How data can help you monitor the most important
“What gets measured gets managed”.
– Peter Drucker
This is a powerful axiom from the Austrian-American management consultant. The idea revolves around focusing on things we want to manage in our companies and organizations.
Once we have the list of items, we can then figure out how to measure them in quick, easily digestible, statistics called ‘Key Performance Indicators’ or ‘KPIs’.
But, what should we track? How much should we be tracking? How do we track?
If Life Give You Lemons
Let’s say you have a business selling lemonade on the street. It’s more on the sour-side and not too sweet so it differentiates you well from the competition. Now, you want a KPI for your business so you could track how many cups of lemonade you sell, the number of cups sold per hour, or every three hours. You could also track the number of people you talk to or how many lemons you squeezed. But what is relevant?
The answer is, it depends. No business is the same and KPIs could mean different things for different companies and brands. However, Alan Mulally, the CEO of Ford who turned the company around from financial failure to profitability, once gave some great guidelines when it comes to tracking KPIs. He stated, a leader should only have 3-6 KPIs for each goal you are working towards.
Remember, KPI’s are simply a tool for measuring performance. They are meant to indicate a specific part of your business so you know what is doing well, and what needs help.
In Mulally’s example, he chose profitable growth of the business as the goal. He then focused on groups which contributed to the growth, specifically: investors, employees, customers, and suppliers. For each group, he then found 1-2 data points which represented how the group was doing.
Since the groups are now being measured, the goal can now be managed, achieved and worked on.
Getting the right data
You might be asking, “How do I get the right data to start tracking these?”. The good news is, in most cases, you probably have data to help you focus on your goals.
Want to know how customers are doing? Look at their frequency and buying patterns. What are your employees feeling? You could look at the yearly HR survey, but why not couple that with how often they are closing work items this year compared to last year? Are they burned out? Are your suppliers delivering on time and are you paying on time? What other data do you have that could be useful?
There are some occasions where you might not have all the data needed, but you can get it relatively easy. Want to see the general interest in your product category? Check out Google Trends. Population statistics? Look at the Census Bureau. Trends in business? Visit Enigma.
There are so many places to get data from.
The main idea is to focus on your goals and let your goals determine what data you need, not the other way around.
Key Takeaways
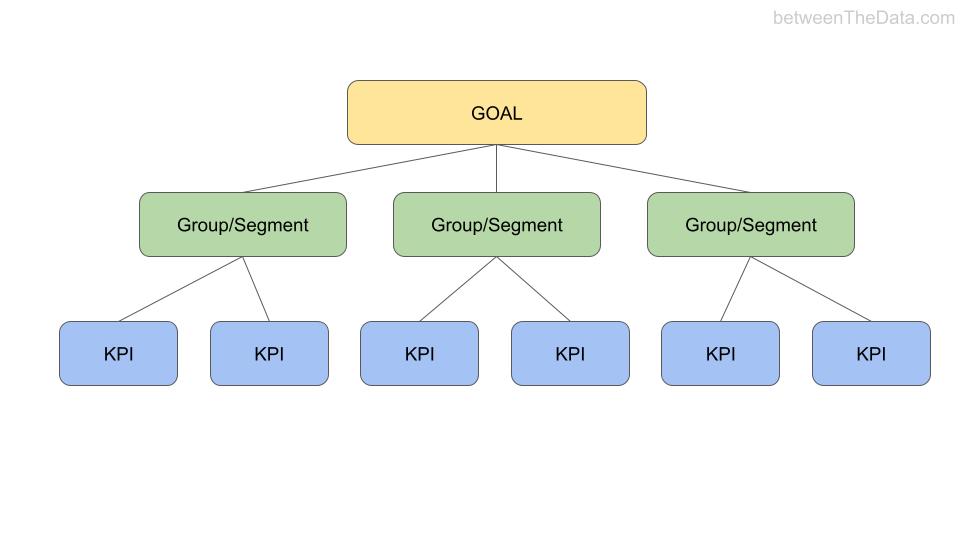
Here are the key steps to follow:
- Pick a specific goal
- Break that goal into specific groups or segments
- Find one – two metrics / pieces of data to help support each group/segment

Need help breaking down your goal or knowing what data to use to help you measure your goals?
Contact me or set up a 15min. call