Data is Icing on the Doughnuts
This article was published in collaboration with Staci Nayeri from Beyond Benchmarks LLC.
Contact her for operations improvement support.
If you couldn’t tell, my love data for data runs deep. One aspect of data analysis is looking for efficiencies in processes. The specific name for this type of data work is ‘Industrial Engineering’.
The data looked at revolves around time it takes to perform certain tasks. A task could be anything: printing a widget, stepping into a roller coaster, washing and drying hands, etc.
It then asks “What If?” to try and make things more efficient.
“What if the we printed the widget with 2 machines instead of one, would it save much time?”
“What if the side of the roller coaster was slightly smaller so riders didn’t have to lift their legs as high?”

“What if the paper towel dispenser was closer to the sink so people didn’t run into each other when leaving the bathroom?”

All these questions are asked in the name of efficiency to save time and increase profits.
Working with my friend and fellow Disney alum, Stacy Nayeri, she told me about project she did to help a company make doughnuts faster and more efficiently. It sounded so good, I wanted to share her story here.
Enjoy!
Everyone loves doughnuts, and for a nation-wide doughnut chain, they want to ensure they can feed everyone. To fill those bellies requires 2 things:
1) Understanding of how many doughnuts people want
2) How much they can actually make
Data can answer both questions.
Setting up the kitchen
An iconic doughnut company just built their first doughnut factory. The factory is poised to supply their whole New York market. However, with the demand for doughnuts expected to grow fast they had to ask themselves some questions:
- Would the factory be able to keep up with the demand for the fried dough-wheels of goodness?
- How many shops could they open?
- Would they need to change how the factory makes doughnuts?
- Would they need to produce doughnuts at some of the shops rather than supplying from the factory?
Just like a doughnut without icing isn’t complete, the number of doughnuts to make isn’t found without data.
There are two flavors of data the doughnut chain needs to know: capacity & demand.
Calculating Capacity

The formula to calculate doughnut capacity is relatively straightforward:
Capacity = Available Time / (Cycle Time x Items per Cycle)
Cycle Time = Time required to produce a single doughnut
Items per Cycle = Number of doughnuts made in a cycle
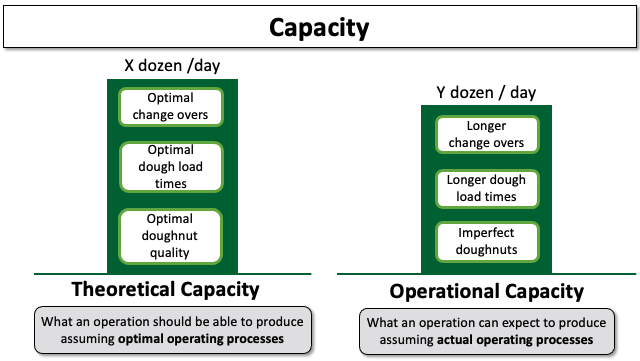
However, it’s not so simple in practice. There are two different types of capacity:
- Theoretical = What an operation should be able to produce assuming optimal processes
- Operational = What an operation can expect to produce assuming actual processes
Theoretical Capacity
Teams can hit production out of the ballpark and operate at theoretical capacity on important days, but that can’t be sustained every day.
For example, at Disney World, rides and attractions are much more efficient during the holiday peaks when crowds are high. Theoretical capacity is met then, however, those performance levels aren’t realistic most days due to a lower sense of urgency, lower staffing, and/or maintenance issues.
Operational Capacity
While Theoretical capacity is often used for planning, it’s difficult to predict actual process inefficiencies on a new design.
Once the process goes live, or in this case the doughnut factory starts churning out doughnuts, on-site time studies are usually necessary to gather data on the actual process.
These studies captured batch yields (quality), the time it takes to start a new batch, and changeovers between varieties. This provides operational capacity.
Understanding Demand

Bringing demand into the picture is where data starts to become helpful information.
Demand = The number of products or services customers want
This could simply be your actual production or sales. However, if you don’t have enough capacity, you could be unintentionally “rejecting” demand. Guests not choosing to wait in long lines and running out of products are two ways this materializes. Ensure that demand projections account for any “rejected demand” and do not just reflect history.
Tracking how often you run out of an item (“stockouts”) can give a gauge of what was rejected. Although, sometimes guests will get their second choice, which should also be factored in.
The Results
Bringing capacity and demand together tells the story. In this case, the factory would reach operational capacity by the end of the year, limiting further market growth.
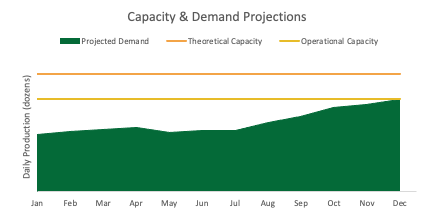
Studies showed there was potential to increase operational capacity by 20%.
As a result, the team is pursuing several tactics to increase operational capacity and take full advantage of the existing facility. Here are some ways to do that:
- Implement an Overall Equipment Effectiveness (OEE) tracking system, making quality and delays visible and actionable
- Adjust shifts, reducing equipment down time
- Improve production standards, reducing cycle time
- Test equipment innovations, reducing delays
Icing & Sprinkles
Using data we were able to find opportunities to save time and money and make money.
In this case, just a few operational tweaks can produce returns and output by ~20% and ensure there is still room to grow in this brand new factory!